A visualization function using ggplot2.
Arguments
- df
A clean data frame with attributes or tuples containing a mixture of samples.
- x
The X-variable often the cycle number OR time.
- y_list
A character vector of samples that need to be plotted. Often of the format TNP (Test, Negative, Positive).
- xlim
The X-variable scale.
- ylim
The Y-variable scale.
- xlab
The X axis label. Takes a string.
- ylab
The Y-axis label. Takes a string.
- title
Graph title. Takes a string.
Examples
fpath <- system.file("extdata", "dat_1.dat", package = "normfluodbf", mustWork = TRUE)
dat_df <- normfluodat(fpath,3,40, rows_used = c('A','B','C'), norm_scale = 'one')
#> 🐷🐫
#> YIKES, value < 2^11, Watch in future experimental designs column: 27 row: 1
#> 🐷🐫
#> YIKES, value < 2^11, Watch in future experimental designs column: 27 row: 2
#> 🐷🐫
#> YIKES, value < 2^11, Watch in future experimental designs column: 27 row: 3
#> 🐷🐫
#> YIKES, value < 2^11, Watch in future experimental designs column: 27 row: 4
#> 🐷🐫
#> YIKES, value < 2^11, Watch in future experimental designs column: 27 row: 5
#> 🐷🐫
#> YIKES, value < 2^11, Watch in future experimental designs column: 27 row: 6
#> 🐷🐫
#> YIKES, value < 2^11, Watch in future experimental designs column: 27 row: 7
#> 🐷🐫
#> YIKES, value < 2^11, Watch in future experimental designs column: 27 row: 8
#> 🐷🐫
#> YIKES, value < 2^11, Watch in future experimental designs column: 27 row: 9
#> 🐷🐫
#> YIKES, value < 2^11, Watch in future experimental designs column: 27 row: 10
#> 🐷🐫
#> YIKES, value < 2^11, Watch in future experimental designs column: 27 row: 11
#> 🐷🐫
#> YIKES, value < 2^11, Watch in future experimental designs column: 27 row: 12
#> 🐷🐫
#> YIKES, value < 2^11, Watch in future experimental designs column: 27 row: 13
#> 🐷🐫
#> YIKES, value < 2^11, Watch in future experimental designs column: 27 row: 14
#> 🐷🐫
#> YIKES, value < 2^11, Watch in future experimental designs column: 27 row: 15
#> 🐷🐫
#> YIKES, value < 2^11, Watch in future experimental designs column: 27 row: 16
#> 🐷🐫
#> YIKES, value < 2^11, Watch in future experimental designs column: 27 row: 17
#> 🐷🐫
#> YIKES, value < 2^11, Watch in future experimental designs column: 27 row: 18
#> 🐷🐫
#> YIKES, value < 2^11, Watch in future experimental designs column: 27 row: 19
#> 🐷🐫
#> YIKES, value < 2^11, Watch in future experimental designs column: 27 row: 20
#> 🐷🐫
#> YIKES, value < 2^11, Watch in future experimental designs column: 27 row: 21
#> 🐷🐫
#> YIKES, value < 2^11, Watch in future experimental designs column: 27 row: 22
#> 🐷🐫
#> YIKES, value < 2^11, Watch in future experimental designs column: 27 row: 23
#> 🐷🐫
#> YIKES, value < 2^11, Watch in future experimental designs column: 27 row: 24
#> 🐷🐫
#> YIKES, value < 2^11, Watch in future experimental designs column: 27 row: 25
#> 🐷🐫
#> YIKES, value < 2^11, Watch in future experimental designs column: 27 row: 26
#> 🐷🐫
#> YIKES, value < 2^11, Watch in future experimental designs column: 27 row: 27
#> 🐷🐫
#> YIKES, value < 2^11, Watch in future experimental designs column: 27 row: 28
#> 🐷🐫
#> YIKES, value < 2^11, Watch in future experimental designs column: 27 row: 29
#> 🐷🐫
#> YIKES, value < 2^11, Watch in future experimental designs column: 27 row: 30
#> 🐷🐫
#> YIKES, value < 2^11, Watch in future experimental designs column: 27 row: 31
#> 🐷🐫
#> YIKES, value < 2^11, Watch in future experimental designs column: 27 row: 32
#> 🐷🐫
#> YIKES, value < 2^11, Watch in future experimental designs column: 27 row: 33
#> 🐷🐫
#> YIKES, value < 2^11, Watch in future experimental designs column: 27 row: 34
#> 🐷🐫
#> YIKES, value < 2^11, Watch in future experimental designs column: 27 row: 35
#> 🐷🐫
#> YIKES, value < 2^11, Watch in future experimental designs column: 27 row: 36
#> 🐷🐫
#> YIKES, value < 2^11, Watch in future experimental designs column: 27 row: 37
#> 🐷🐫
#> YIKES, value < 2^11, Watch in future experimental designs column: 27 row: 38
#> 🐷🐫
#> YIKES, value < 2^11, Watch in future experimental designs column: 27 row: 39
#> 🐷🐫
#> YIKES, value < 2^11, Watch in future experimental designs column: 27 row: 40
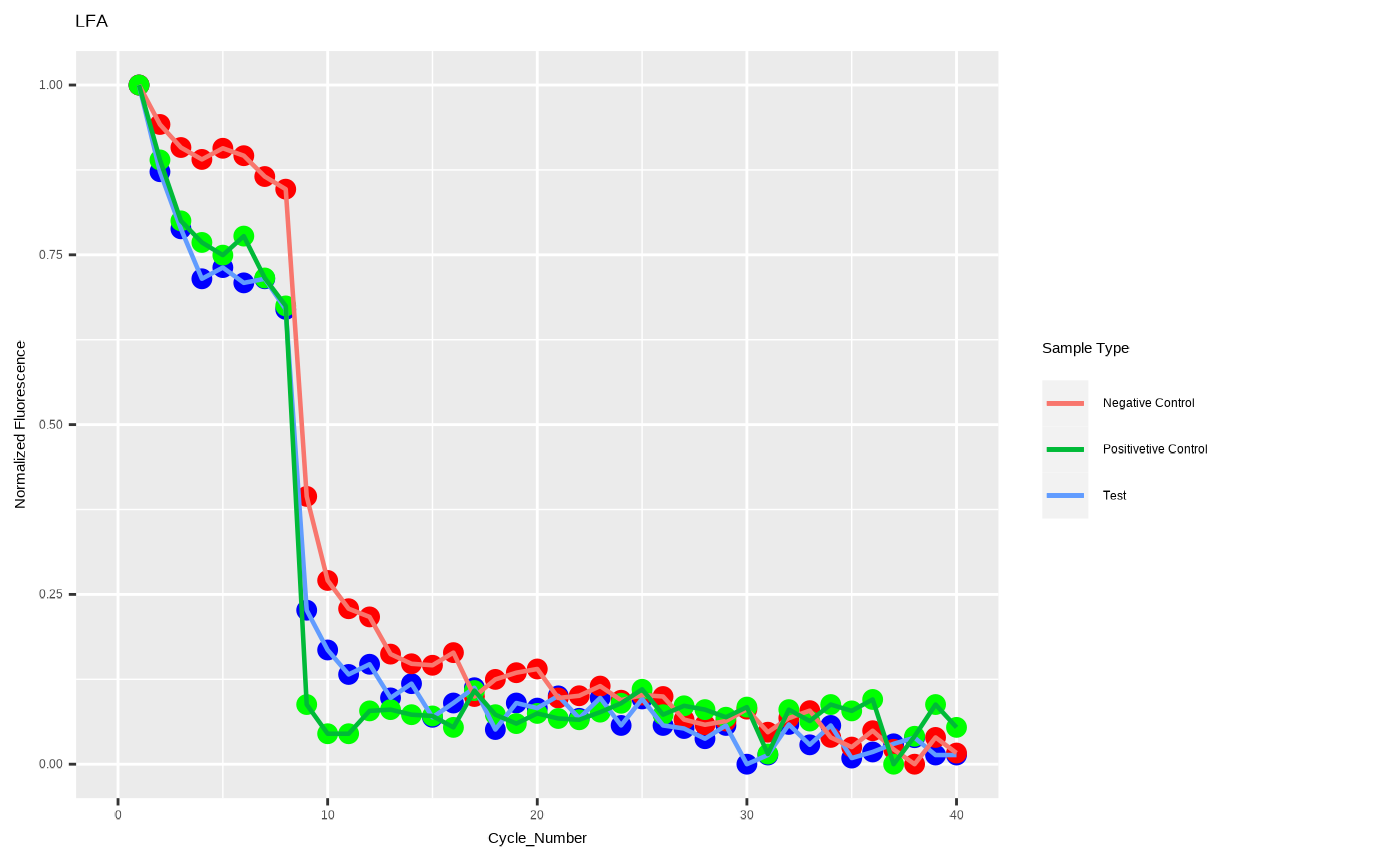
yvars <- c("A1","B1","C1")
xvar <- c("Cycle_Number", "Time")
xl <- c(0,40)
yl <- c(0,1)
ggplot_tnp(dat_df,xvar,yvars,xl,yl,xlab='Cycle_Number',ylab='Normalized Fluorescence',title='LFA')